Volumes
Volumes is an exhibition dedicated to graphic design and books, presented at Le Bel Ordinaire in 2018, then at the University Library of Le Havre in 2019 as part of the 11th edition of Une saison graphique. 1
This project stands out for the integration of code, notably Python scripts, into the design of the visual identity as well as the exhibition’s scenography. All these scripts were used to generate the graphic materials and calculate the requirements for the scenographic modules. They are available on GitHub 2
At the heart of the system, a shared document – a CSV file initially listing 585 books from 43 publishers (later 521 for the Le Havre edition) – enabled the centralisation of precise data: publisher, title, author, designer, collection, dimensions, price, URL and cover image. 3 This data was used to design the full-scale display, to generate printed labels to the exact dimensions of the books, and to optimise material choices (thickness of wooden supports, reduction of cut-outs).
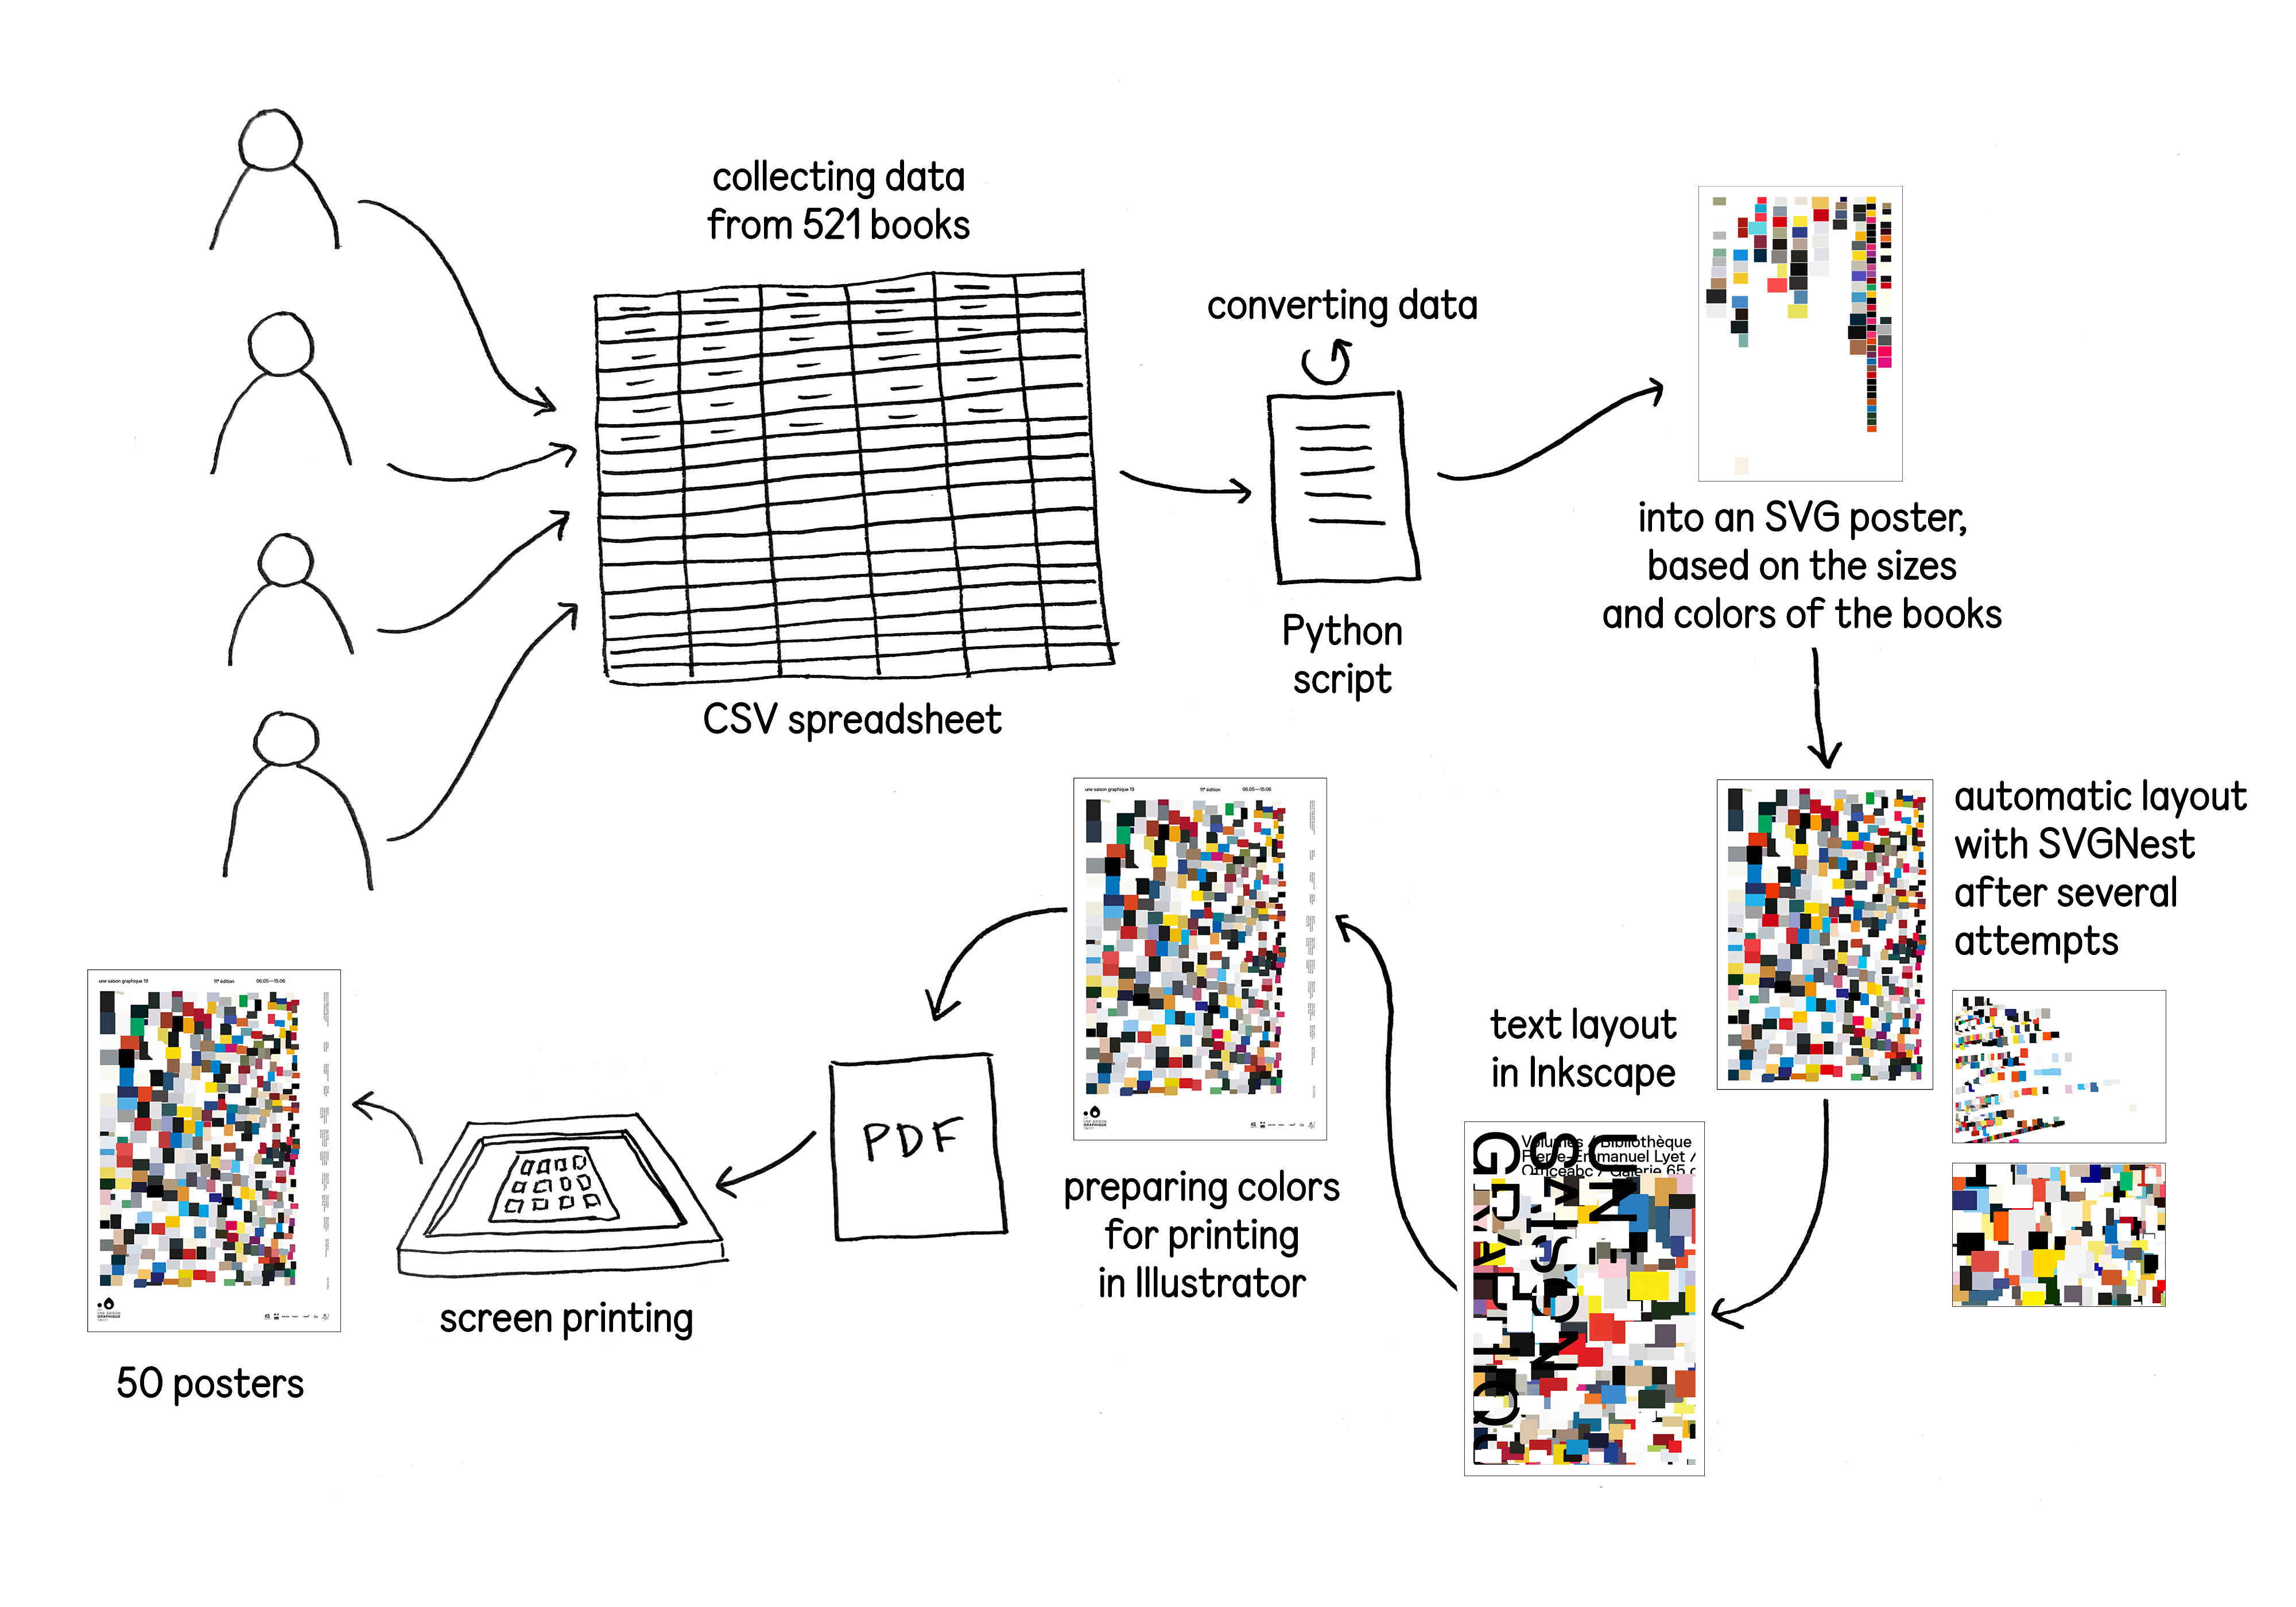
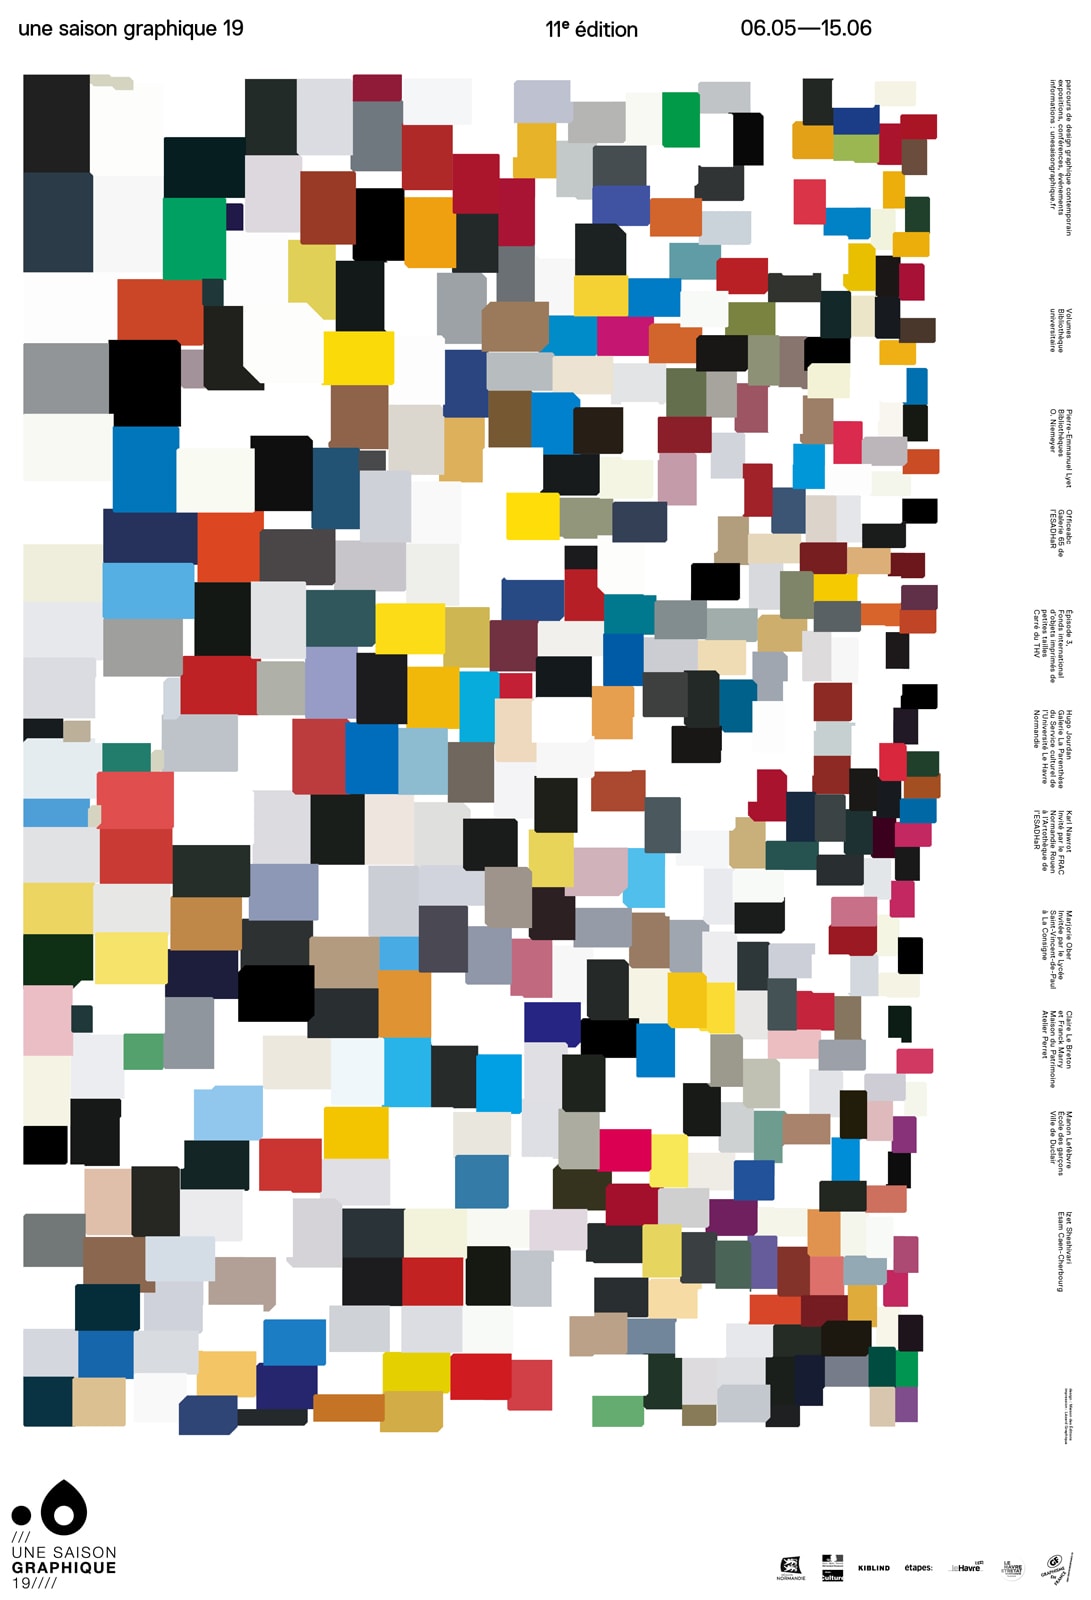
For the exhibition in Le Havre, this information was also used to create a programme poster designed collectively by members of the Maison des éditions and screen-printed by Lézard graphique. A Python script generated an SVG file composed of rectangles sized according to the thickness of the books and coloured according to the dominant hue of their covers. Optimised using the SVGNest script, the final visual conveys the depth of the books in an isometric perspective achieved by superimposing and offsetting the shapes. 4
The project forms part of an experimental approach promoting open-source tools and alternative production methods, notably through web technologies championed by the PrePostPrint initiative (https://volumes.lu/a-propos/laffiche). This approach extends to the production of a ‘fantastical and polychromatic’ catalogue, generated from the exhibition website using Paged.js 5
Volumes brings together the exhibition, visual identity and computer programming within a single design process, where data from the publications becomes the raw material for a scenography and code-generated printed objects. 6
Toolchain
CSV > Python > SVG > SVG Nest > Illustrator > PDF
Infos
Link
Type
Poster
Designer(s)
Claire Colnot, Benjamin Lahitte, Jean-Marc Saint-Paul, Amish Shah and Julien Bidoret
Publisher
Une saison graphique
Printing
Screenprinting: CMYK + Fluo
Pages
1
Size
120 × 175 mm
Technologies
CSV, Python, SVG, SVG Nest
Year
2019
Copies
50
Language
French
Printer
Lézard Graphique
Sitography
Collecting data
Exhibition participants
CSV
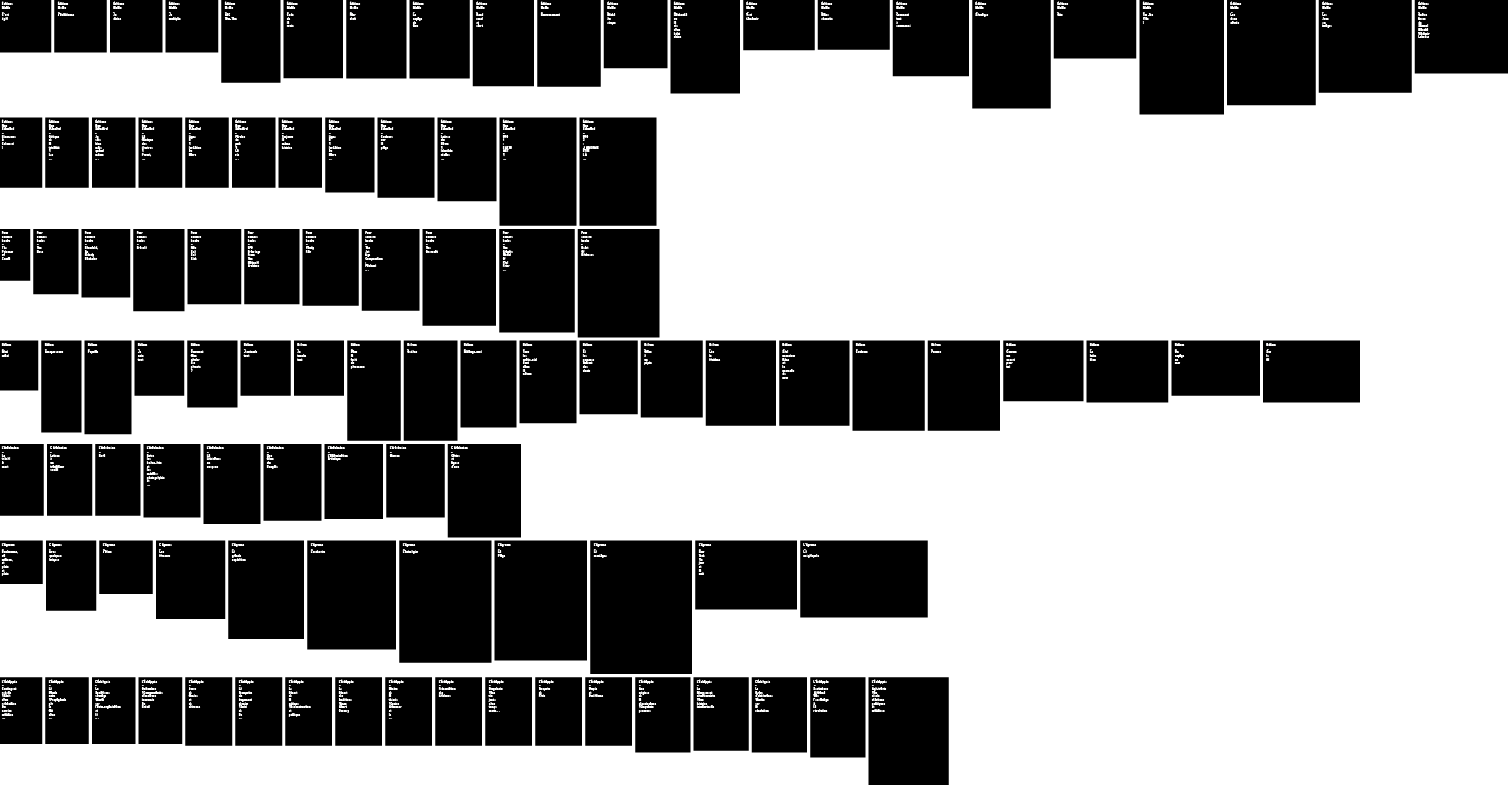
List the 521 exhibited books in a shared CSV file (publisher, title, author, designer, collection, as well as height, width, depth, price, URL, and cover photo).
CSV File
Transforming data
Graphic designers (Claire Colnot, Benjamin Lahitte, Jean-Marc Saint-Paul, Amish Shah and Julien Bidoret)
Python
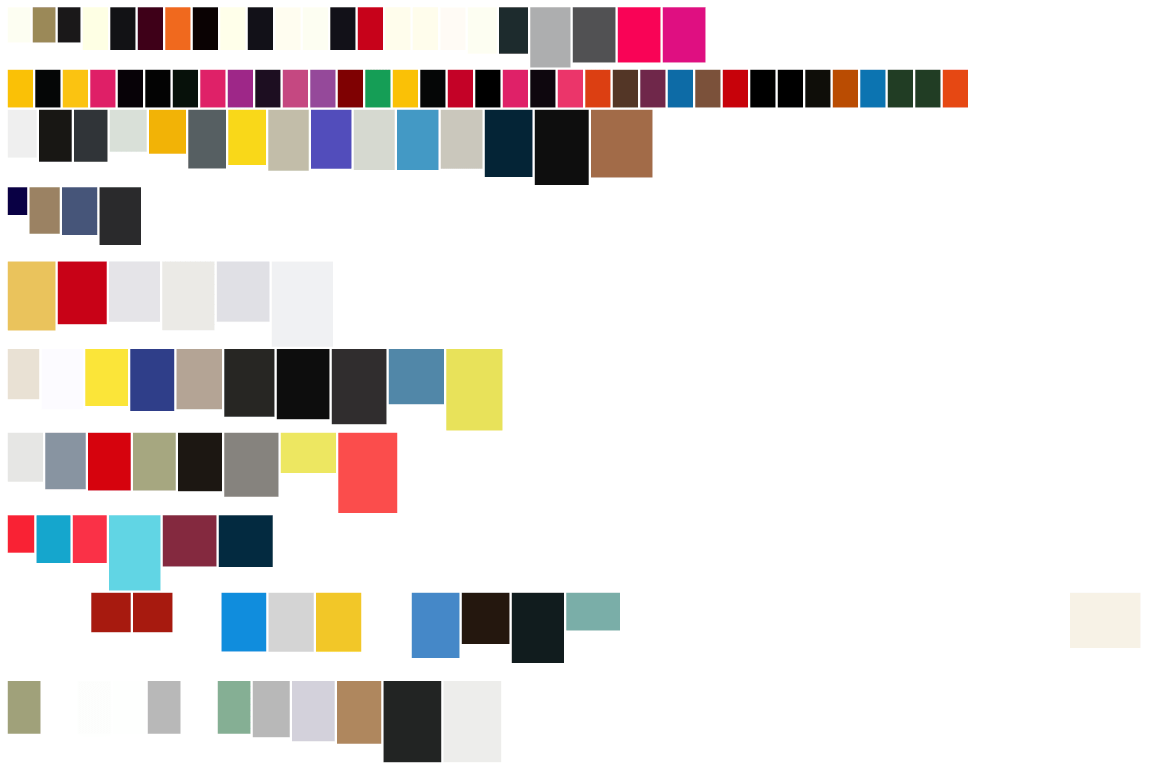
Python script for generating an SVG file of rectangles correctly sized and colored according to the dominant color of the cover.
A series of poster designs
One selected poster
Layout
Graphic designers (Claire Colnot, Benjamin Lahitte, Jean-Marc Saint-Paul, Amish Shah et Julien Bidoret)
SVGNest
Inkscape
The SVG was then optimized using the SVGNest script, allowing the rectangles to be condensed within the poster space.
Poster layout in Inkscape
SVG Poster
Exporting
Graphic designers (Claire Colnot, Benjamin Lahitte, Jean-Marc Saint-Paul, Amish Shah et Julien Bidoret)
Illustrator
SVG was then processed in Illustrator
Export and color preparation
Fluorescent color mixing(done by Benjamin Lahitte with Lézard Graphique)
PDF ready to print
Forced to use proprietary software for colorization, habits of the graphic designer and printer
Printing
Lézard Graphique
Screenprinting
Poster screenprinting
Printed poster